Debugging Blazor WebAssembly Application in Browser

This article is going to explain how to debug the Blazor WebAssembly application on the Chrome browser's Dev tool. Let’s look at it step by step
Step 1:
I have developed a small calculate application in Blazer to demonstrate the debugging process. It calculates simple arithmetic. If users click the Calculate button it will display the results. The following is a screenshot of the calculated code snippet.

Step 2:
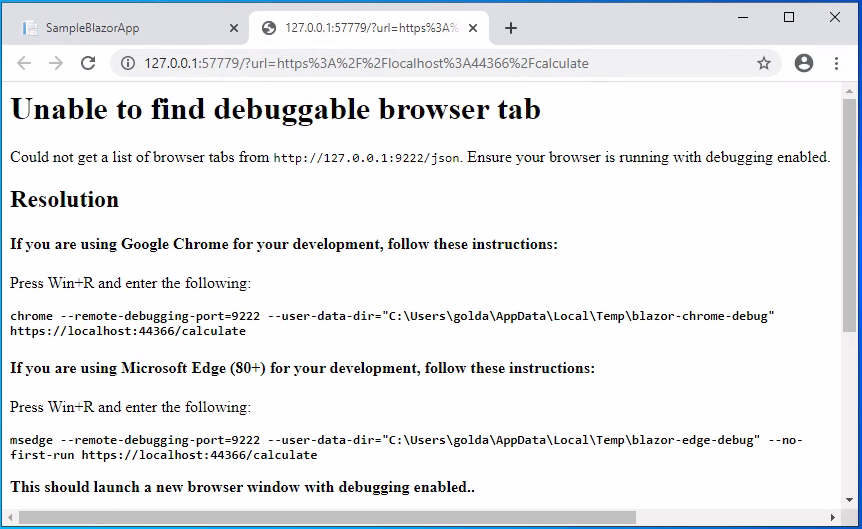
Press Shift+Alt+D (When focusing the application). This will open a new tab with the message “Unable to find debuggable browser tab”. But at the same time, the page gives instructions on how to get this.
Step 3:
Press Win + R. This will open a run window. Enter the command specified on the page in the open text box (chrome --remote-debugging-port=9222 --user-data-dir="C:\Users\golda\AppData\Local\Temp\blazor-chrome-debug" https://localhost:44366/calculate). And click ok. This will reopen the application in another Chrome browser.

Step 4:
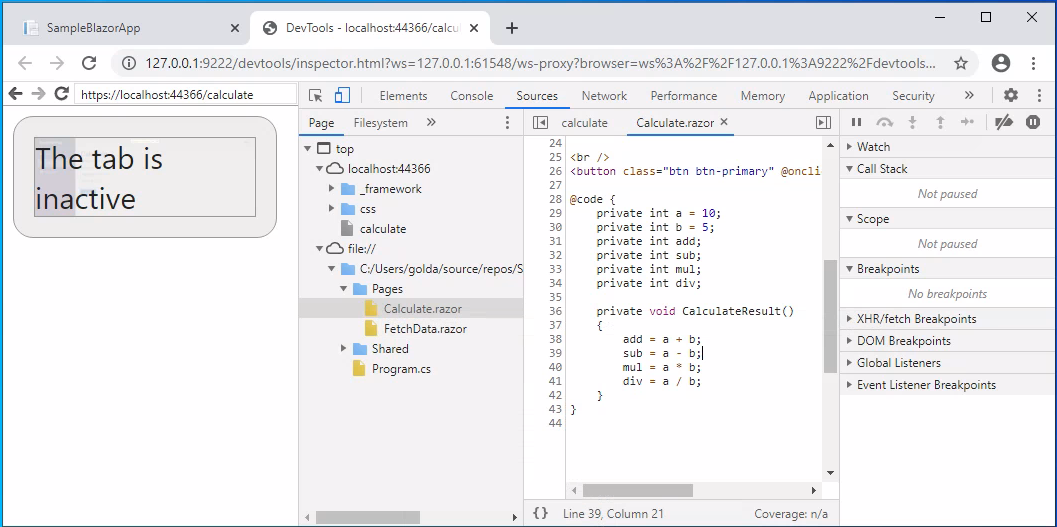
Press Shift + Alt + D again (When focusing the application). This will open the Chrome Dev tool. In that Select the file:// -> Pages -> Calculate.razor. This will display the page code. It can be seen in the following image.
Step 5:
The following GIF image illustrates how to set a breakpoint and how to debug the Blazor WebAssembly. Set the breakpoint by clicking on the line number. Then go to the app and run the app. It will activate the breakpoint.

Step 6:
On the chrome dev tool, on the right-hand side, you will find the watch tab. There you can add a watch expression. The image below illustrates the watch expression process.

I hope this helps you. Keep coding.


Comments
Post a Comment